One core carries 14,330 OAuth2 requests in Go and 5,152 in PHP-FPM
The same API verifies an RS256 bearer token on every request and then reads or writes one row in PostgreSQL — on one, two and four cores, how much mixed traffic does it carry in Go, PHP-FPM and FrankenPHP worker mode?
Finding
On four cores Go carried 57,321 mixed requests a second, FrankenPHP 25,659 and php-fpm 20,606 — 14,330, 6,415 and 5,152 per core. The number that goes into a capacity plan is not that one but application CPU per request: 66.8, 110.7 and 187.7 microseconds. At saturation FrankenPHP uses only 2.84 of its four cores, against Go's 3.83 and php-fpm's 3.87. The database is not the constraint: on the same four cores PostgreSQL alone writes 68,212 rows a second, above the mixed ceiling of the fastest candidate.
- Capacity per core · Go
- 14,330 req/s
- Capacity per core · PHP-FPM
- 5,152 req/s
- CPU per request · Go → PHP-FPM
- 66.8 → 187.7 µs
- FrankenPHP · cores used at saturation
- 71%
- PostgreSQL · its own INSERT ceiling
- 68,212 rows/s
Method
One contract, written three times, verifying an RS256 bearer token on every request (signature, iss, aud, exp, nbf, scope). The candidates are Go 1.27.1 (net/http, pgx, golang-jwt), PHP 8.5.10 behind nginx and php-fpm, and PHP 8.5.10 on FrankenPHP 1.12.7 in worker mode; no framework, and the two PHP candidates run the same class. The load is mixed: two open-loop generators at the same instant, one reading and one writing, each with its own access token. Every candidate was measured on 1, 2 and 4 pinned cores at the pool size that suited it best at that budget, chosen by a separate sweep over 8/16/32/64. The published figure is a closed-loop saturation ceiling: five repetitions per cell, each preceded by an nginx running no application code on the candidate's own cores driven at 115% of the rate the candidate was expected to reach — 45 of 45 repetitions passed that gate — and the best repetition is reported. CPU and memory come from cgroup counters; the host's own load was recorded beside every repetition. Across the whole run, 333 load measurements and 110,617,180 answers; the published ceiling phase is 45 of those and 18,551,833 answers. No measurement saw a non-2xx answer or a transport error.
- Measured on
- Published
measured yesterday
Environment
- Go
- 1.27.1 · net/http · pgx 5.11.0 · golang-jwt 5.3.1
- PHP
- 8.5.10 · opcache on · JIT off · firebase/php-jwt 7.1.1
- PHP-FPM
- nginx 1.26.3 + php-fpm in one container · pm=static
- FrankenPHP
- 1.12.7 (Caddy 2.11.4) · worker mode · ZTS
- Database
- PostgreSQL 17.11 · 1,000,000 rows · synchronous_commit on
- Load generator
- oha 1.15.0 · two concurrent generators · 64 connections each
- Hardware
- Apple M4 Pro · 12 cores · 24 GB · macOS 27.0
- Virtualisation
- Docker Desktop 29.8.0 · 12 vCPU / 7.75 GB · aarch64
- Core split
- candidate 0-3 · PostgreSQL 4-7 · load 8-11
- Estimator
- five repetitions per cell, best of those that passed the generator probe
Technologies
To reproduce
./bench/build.sh && ./bench/verify.sh && STAMP=$(date -u +%F) ./bench/capacity.sh --allWhen I proposed Go for an OAuth2 service that had to answer tens of thousands of requests a second, the team asked a fair question: how much do we actually gain? “Go is faster” does not answer it, because what goes into a capacity plan is not requests per second but cores. So I wrote the same API three times and measured all three on one, two and four cores, under the same traffic — half of it reads, half of it writes. Every raw run is in the php-go-bench repository.
What was measured
Three endpoints, the same contract in all three candidates. Each one verifies
the bearer token first: RS256 signature, iss, aud, exp, nbf and the
scope the endpoint requires. No candidate caches verification.
| Candidate | HTTP | Database idiom | Pool size (1c / 2c / 4c) |
|---|---|---|---|
| Go | net/http | pgx, statement cache per connection | 16 / 64 / 64 |
| FrankenPHP (worker) | Caddy, built in | PDO, statement prepared once per worker | 8 / 8 / 8 |
| PHP-FPM | nginx, inside the same core budget | PDO, one parameterised round trip | 8 / 16 / 32 |
The load is mixed: two open-loop generators run at once, one reading a single
row by primary key out of a million with GET /events/{id}, the other writing
one INSERT … RETURNING with POST /events. Each sends its own access token.
The capacity published here is a saturation ceiling, not a service level. It is the highest rate at which the candidate kept up with its answers; it carries no promise that p99 stayed under some threshold. I tried three times to measure that as well, and all three attempts came out unreliable on this bench; the reason is in the limits below. The latency at the ceiling is printed beside it, so you can see what the number costs.
Capacity per core
Saturation ceiling under mixed OAuth2 traffic
Each bar is the total requests a second the candidate kept up with at that core budget — reads and writes together.
- Go
- FrankenPHP (worker)
- PHP-FPM
Source: Five repetitions per cell, best of those that passed the generator probe — bench/capacity-report.mjs
Data table
| Series | 1 core | 2 cores | 4 cores |
|---|---|---|---|
| Go | 16,883 | 29,449 | 57,321 |
| FrankenPHP (worker) | 6,544 | 14,306 | 25,659 |
| PHP-FPM | 6,218 | 11,211 | 20,606 |
The chart is drawn in the browser; the table below carries the same data.
On four cores Go carries 2.78 times what php-fpm carries and 2.23 times what FrankenPHP carries. Per core the gap reads more plainly: 14,330 against 6,415 and 5,152.
All three scale close to linearly with cores, and none of them scale exactly. Going from one core to four, Go keeps 84.9% of the theoretical fourfold and php-fpm 82.8%. FrankenPHP’s 98% is misleading — its denominator is its own low single-core figure.
| Candidate | Ceiling (4c) | Per core | p50 at the ceiling (read/write) | p99 at the ceiling | Peak RSS |
|---|---|---|---|---|---|
| Go | 57,321/s | 14,330 | 1.81 / 2.42 ms | 4.69 / 5.41 ms | 30.4 MiB |
| FrankenPHP (worker) | 25,659/s | 6,415 | 4.77 / 4.96 ms | 8.80 / 9.06 ms | 60.3 MiB |
| PHP-FPM | 20,606/s | 5,152 | 6.03 / 6.24 ms | 8.27 / 8.45 ms | 60.0 MiB |
That is not the number for your table
The 57,321 on four cores is true for four cores only. What carries over to your own target is not requests per core but CPU per request:
Application CPU per request, at the saturation ceiling
The candidate's cgroup CPU counter divided by the requests it answered. The database's CPU is not included.
- Go
- FrankenPHP (worker)
- PHP-FPM
µs lower is better Source: Saturation ceiling runs, best valid repetition
Data table
| Series | 1 core | 2 cores | 4 cores |
|---|---|---|---|
| Go | 57.8 µs | 63.65 µs | 66.77 µs |
| FrankenPHP (worker) | 82.77 µs | 100.68 µs | 110.74 µs |
| PHP-FPM | 157.07 µs | 173.83 µs | 187.74 µs |
The chart is drawn in the browser; the table below carries the same data.
Multiply this by your target rate and you have the cores you need. For 30,000 mixed requests a second the arithmetic gives 2.0 cores in Go, 3.3 in FrankenPHP and 5.6 in php-fpm.
In all three candidates CPU per request rises with the core count — Go from 57.8 to 66.77 µs, php-fpm from 157.07 to 187.74. This is the same non-linearity seen from the CPU counter: as concurrency grows, context switching, locking and cache misses take a larger share of each request. When you plan, use the column for the instance size you are actually buying; do not take the single-core figure and multiply it by four.
The cores FrankenPHP cannot use
FrankenPHP’s CPU per request is 41% below php-fpm’s (110.74 against 187.74 µs). That saving does not fully turn into capacity, because at saturation it cannot finish its cores:
| Candidate | Cores used of 1 | of 2 | of 4 |
|---|---|---|---|
| Go | 0.98 (98%) | 1.87 (93.5%) | 3.83 (95.8%) |
| PHP-FPM | 0.98 (98%) | 1.95 (97.5%) | 3.87 (96.8%) |
| FrankenPHP (worker) | 0.54 (54%) | 1.44 (72%) | 2.84 (71%) |
On a single core FrankenPHP carries only 5% more than php-fpm (6,544 against 6,218) even though it spends roughly half the CPU per request. The whole of that advantage disappears into the idle core. On two and four cores the constraint loosens and the gap opens to 28% and 25% — but a third of the budget still goes unused.
This record did not measure where the constraint is. It is not the pool size: 8, 16, 32 and 64 workers were all tried, and FrankenPHP picked 8 at every core budget, so more concurrency does not help it. It could be the hand-off between Caddy and the PHP threads, or the ZTS build. The practical consequence is this: moving to FrankenPHP does the same work with less CPU time, but it does not give you back a third of the cores you are paying for.
The database is not the constraint
The 1.16 cores FrankenPHP leaves idle are on the application side. Where does PostgreSQL sit under the same load?
| Measurement | Value | Cores used of 4 |
|---|---|---|
| PostgreSQL alone, pgbench INSERT | 68,212 rows/s | 3.45 |
| What the database does while Go saturates | 24,930 writes + 32,392 reads/s | 2.34 |
| While FrankenPHP saturates | 12,575 writes + 13,084 reads/s | 1.11 |
| While php-fpm saturates | 10,128 writes + 10,478 reads/s | 1.46 |
Even with the fastest candidate at its ceiling PostgreSQL uses 2.34 of its four cores, and its own ceiling is well above that point. In this workload the choice is entirely on the application runtime: changing the database does not move the capacity plan; changing the language moves it by a factor of 2.78.
One detail does show up on the database side. PostgreSQL CPU per request is 40.75 µs with Go, 43.2 with FrankenPHP and 71.07 with php-fpm. The two candidates that can reuse a statement are close together; the one that cannot makes the database do 74% more work per request. The likely cause is every query being parsed and planned again; this record did not measure that separately.
Each candidate at its own best pool size
The first objection to a comparison like this is “you configured PHP badly”. So pool size was swept as its own phase before the measurement: every candidate, at every core budget, was driven flat out twice at 8, 16, 32 and 64, and entered the measurement with its own best. The pool size is also the database connection ceiling, so it stays one knob for all three.
| Candidate | 1 core | 2 cores | 4 cores | Cost of the worst choice |
|---|---|---|---|---|
| Go | 16 | 64 | 64 | 70.6% (4c: 8 workers 32,666, 64 workers 55,715) |
| PHP-FPM | 8 | 16 | 32 | 30.7% (1c: 64 workers 4,734, 8 workers 6,188) |
| FrankenPHP (worker) | 8 | 8 | 8 | 29.6% (2c: 32 workers 11,252, 8 workers 14,580) |
No single fixed number is best for all three, and they do not even point the same way: Go wants more concurrency as cores are added; the two PHP candidates want less. On one core, php-fpm with 64 workers does 24% less work than with 8.
Turning your target into cores
| Target rate | Go | FrankenPHP | PHP-FPM |
|---|---|---|---|
| 10,000 req/s | 1 | 1 | 1 |
| 20,000 req/s | 1 | 1 | 1 |
| 30,000 req/s | 1 | 2 | 2 |
| 50,000 req/s | 1 | 2 | 3 |
| 100,000 req/s | 2 | 4 | 5 |
How it was measured
- The budget. The Docker VM’s 12 vCPUs are split into three disjoint sets: candidate 0-3, PostgreSQL 4-7, load generator 8-11. The php-fpm candidate’s nginx lives inside the candidate’s own budget; Go and FrankenPHP serve HTTP themselves. Memory stays at 1 GiB at every core budget, so the axis is cores and nothing else.
- Every cell starts from the same place. Every cell starts from a copy of the seeded
database taken with
CREATE DATABASE … TEMPLATE, pulled into shared buffers withpg_prewarm, followed by aCHECKPOINT, a fresh container and a warm-up. - The generator probe. Before every repetition an nginx that runs no application code is put on the candidate’s own cores and driven by the same pair of generators at 115% of the rate the candidate is expected to reach. A repetition that falls short of the probe has measured the generator rather than the candidate and is excluded. 45 of 45 passed.
- Best repetition as the estimator. The measurement runs on a laptop, and everything else on that machine comes out of the measurement; interference only ever subtracts. The host’s own load was recorded beside every repetition.
- Independent confirmation. The same ceilings were measured twelve hours earlier by the pool sweep at a different connection count, and the two independent measurements agree to within a few per cent.
Limits and honesty notes
- The service-level capacity could not be measured. I tried three separate
methods to answer “the highest rate that keeps p99 under 10 ms”, and all
three came out unreliable on this bench and were discarded. The reason is
that in an open-loop measurement the boundary is a cliff rather than a
slope: once the service slows, the generator falls behind its schedule and
latency correction charges that to the request, and the cliff moves between
repetitions. Repetitions of the same cell differed by up to a factor of
five. The raw data and the diagnosis of all three attempts are in
EXCLUDED.md.
That is why the published figure is a saturation ceiling and
confidenceismedium. - One machine, a laptop. All 12 vCPUs are given to the Docker VM, so anything running on macOS comes straight out of the measurement. That is not an assumption but a measured event: during one run, headless Chromium processes on the host took more than ten cores and the same Go service measured 17,490 requests a second instead of 57,321. That run was discarded, and the probe gate and the host-load record were added because of it.
- The mix is 50/50. If your own traffic is read-heavy, all three ceilings rise, because a read is cheaper than a write. The ratio moves with your profile; measuring CPU per request separately for reads and writes was out of scope here.
- The durability guarantee is unverified. I did not check whether
fsyncon the Docker Desktop VM disk gives the same guarantee as bare metal. Absolute write figures may be optimistic; the comparison between candidates is not affected, because all three write to the same database. - Out of scope. Frameworks, PHP JIT, Swoole and RoadRunner, alternatives to PostgreSQL, the authorization server that mints the tokens, and the team cost of moving code to Go were not measured. What frameworks cost on their own is in the PHP framework load test.
To produce your own number, run php-go-bench with your own token shape and your own query, on your own hardware. The value that goes into your table is CPU per request; the rest is multiplication.
Related posts
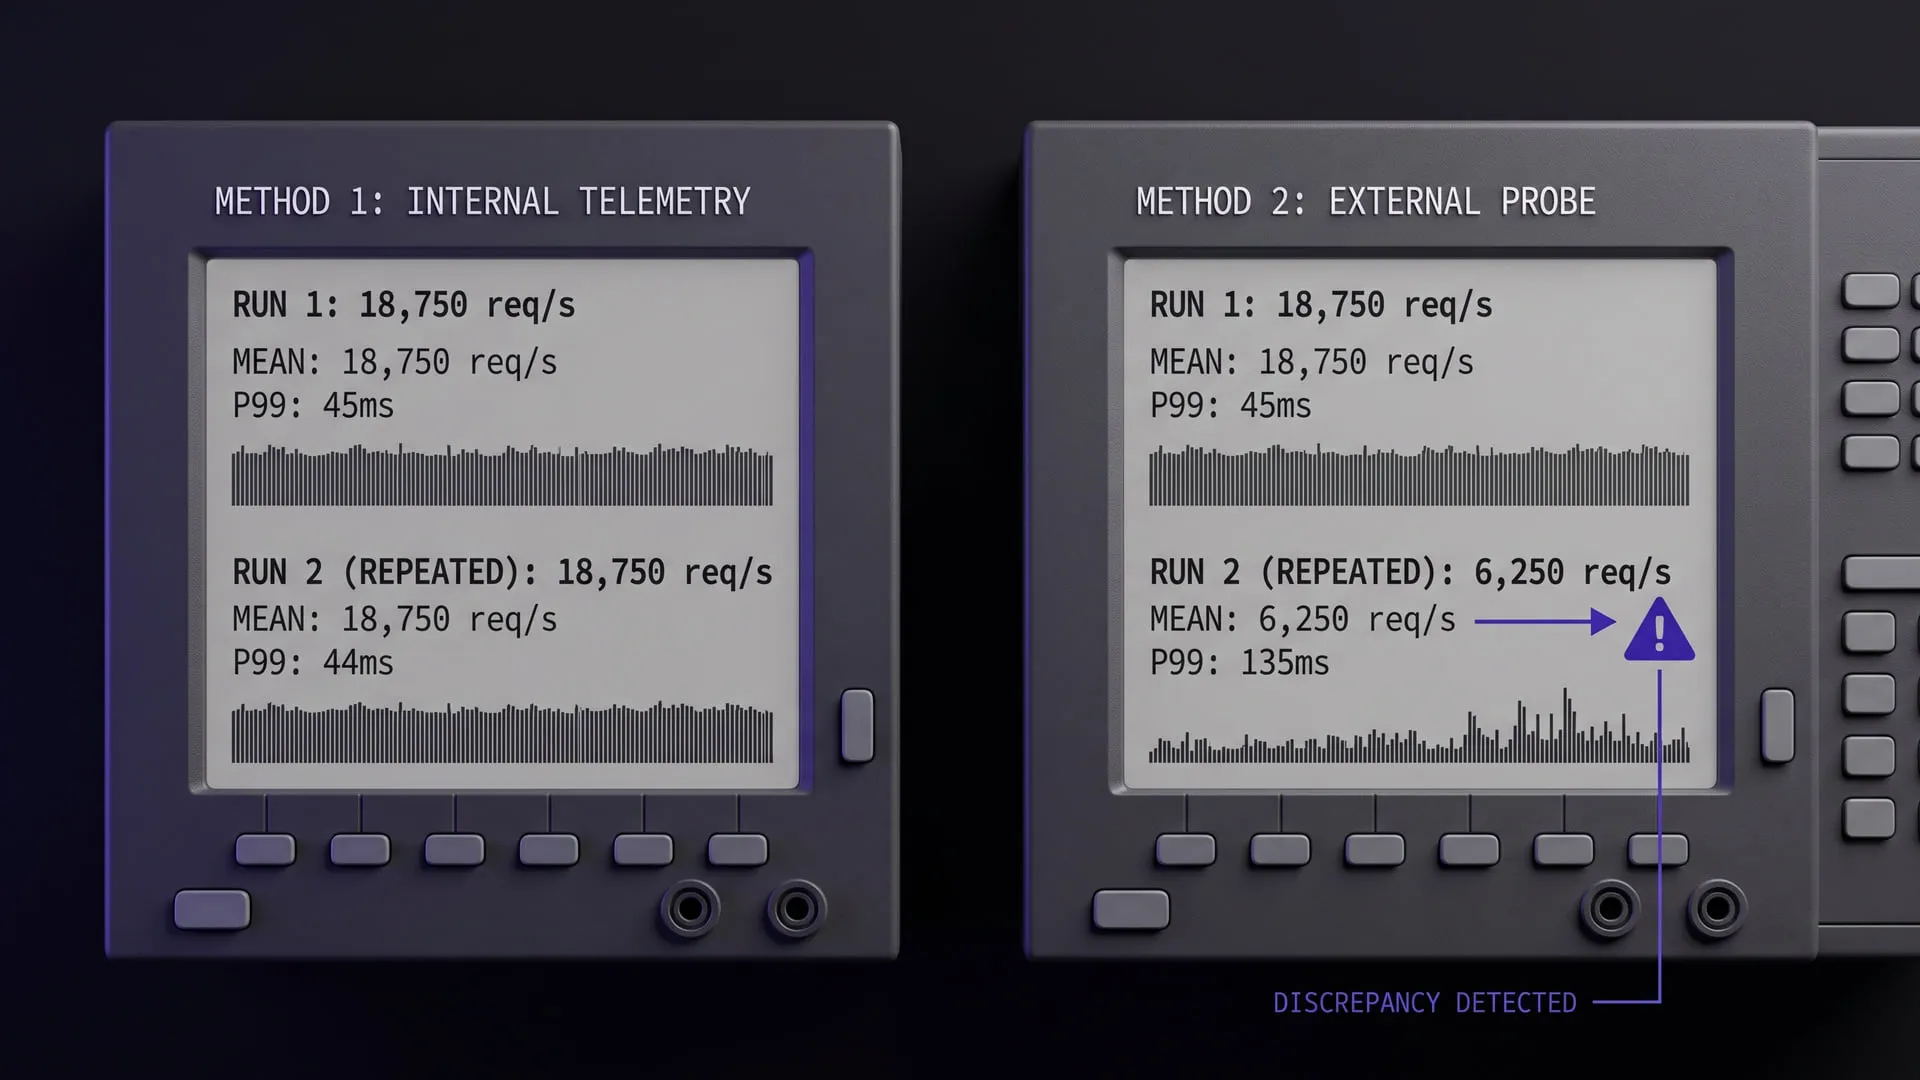
18,750 req/s: precise, repeated, and three times wrong
Two phases of the same run measured the same service three times apart. What caught the wrong one was not a better statistic but a second method.