18,750 req/s: precise, repeated, and three times wrong
Two phases of the same run measured the same service three times apart. What caught the wrong one was not a better statistic but a second method.

The measurement ran three repetitions, all three landed close together, and the median was 18,750. Another phase of the same run had measured the same candidate on the same four cores minutes earlier and said 55,715. Both were internally consistent, and both belonged to the same run.
Where it came from
At work I proposed Go for a service that verifies an OAuth2 token on every request and has to carry tens of thousands of reads and writes a second. The team asked a fair question: how much do we gain? I like measuring things, so this was exactly the kind of question I wanted — and I wrote the same API three times, in Go, php-fpm and FrankenPHP worker mode, and built a bench.
The bench did this: drive mixed traffic (half reads, half writes) at a fixed rate; if the rate held and p99 stayed under ten milliseconds, pass; otherwise fail. Then double the rate, and once one failed, bisect the bracket. Capacity is the highest rate that meets the service level. It is the kind of harness I would write, and so would you.
The number read like a result
For four-core Go the bench reported 18,750 req/s, labelled “median of three repetitions”. Put it in a table and nobody argues.
The same run had a tuning phase, which drove each candidate flat out at different pool sizes to pick the best one. That phase had measured the same Go service on the same four cores at 55,715. Three times apart.
One of them was wrong, and nothing told me which. The ladder’s three repetitions were close to each other; the tuning phase’s two repetitions were close to each other. Both measurements were internally consistent. Consistency is not correctness.
Looking at the data made it worse: the ladder’s repetitions ranged from 1,250 to 48,000. The median was 18,750 because the middle repetition happened to land there.
First diagnosis: correct, and not enough
I read the spoiled windows one by one. The first step of one cell, at 3,000 requests a second, had a write p99 of 10.6 ms — six tenths of a millisecond over the threshold. The read p99 in the same window was 3.3 ms. The blow had landed only on the write half.
The cause was in my own harness. Before every step I put the table back to its
seeded state and issued a CHECKPOINT. When the checkpoint’s writeback spilled
into the measurement window, writes stalled behind it. And the exponential
search turned that into a verdict: when the first step of a cell that would go
on to carry 48,000 is recorded as a failure, the search has no passing rate to
bisect against, turns downwards, and spends the rest of the cell confirming
that Go serves 1,250 requests a second.
I added a settle time after the reset. I made a failing window get measured a second time before the search acted on it. I ran it again.
The second attempt came out worse
| Cell | rep 1 | rep 2 | rep 3 |
|---|---|---|---|
| Go, 1 core | 1,250 | 6,500 | 3,500 |
| php-fpm, 1 core | 1,750 | 2,750 | 750 |
Repetitions of the same cell differed by a factor of five. And this time nothing was spoiled: requests were answered, nothing errored, CPU sat where it always sat. What I had fixed was a real problem, but it was not the problem.
The turn: oha reports two latencies
php-fpm, one core, 3,000 requests a second. All ninety thousand requests answered, the target rate held exactly, median 1.44 ms, CPU at 0.76 of its one core — not even saturated. And p99: 3,718 ms.
The load generator’s output had two separate latency columns:
| p50 | p75 | p99 | slowest | |
|---|---|---|---|---|
| time to first byte | 1.42 ms | 47 ms | 191 ms | 267 ms |
| latency-corrected | 1.44 ms | 1,539 ms | 3,718 ms | 3,819 ms |
The server had answered in 191 ms. The other 3.5 seconds was time the request spent waiting to be sent.
The mechanism: doing the right thing turns the boundary into a cliff
--latency-correction times a request from the moment it was due, not the
moment it was sent. That is the right thing to do: it is the only mechanism
that stops a load generator from politely slowing down alongside the system and
calling the result a pass. The
coordinated omission
literature explains this at length, and stops there.
What it does not cover is what happens after you apply the correction. Once responses are slow enough to occupy the generator’s connections, the schedule slips, and every later request inherits the slip. The result is that a rate is either comfortably met or catastrophically missed, with almost nothing in between. The boundary is not a slope. It is a cliff.
And the cliff moves between repetitions.
That is what a search cannot measure. Exponential search with bisection assumes that pass and fail are monotone in the rate and stable enough to interrogate one point at a time. Neither held. Every repetition asked a different sequence of questions, walked a different path across a moving boundary, and reported wherever its walk had stopped.
The fix, and one more lie
I threw the search away. In its place, seven fixed rates per cell — the same seven in every repetition — and a rate counts as carried when a majority of the repetitions carried it. There is nothing to steer: a spoiled window costs one point in one repetition, and the vote absorbs it.
Then the host lied. While I was running the ceiling phase, the numbers were nonsense again: four-core Go at 17,490 req/s. I looked at the processes — about thirty headless Chromium processes on macOS were using 1,019% CPU between them. More than ten of the machine’s twelve cores. The Docker VM had been left with 94%.
That was not my harness’s fault, but it was something my harness should have seen. I added two things: a probe before every repetition — an nginx that runs no application code, put on the candidate’s own cores and driven at 115% of the rate the candidate is expected to reach, so a repetition that falls short has measured the generator and not the candidate, and is excluded — and, beside every repetition, a record of what macOS itself was doing at that moment.
The result
On an idle machine, five repetitions per cell: 45 of 45 passed the probe. Go’s five repetitions on four cores landed between 55,836 and 57,321, median 56,571. And twelve hours earlier, at a different connection count, in a closed loop, the tuning phase had said 55,715.
Two independent measurements agreed to within a few per cent. That is what told me the number was right — not a statistic, but a second method.
What I took from it
A measurement that produces obvious garbage is good news: you look at it. The dangerous one is wrong to three decimal places with “median of three repetitions” printed next to it, because that number goes into a presentation and nobody argues with it.
A single measurement cannot audit itself. More repetitions do not fix it — my three were consistent with each other. A better statistic does not fix it either; the median picked exactly the wrong middle repetition.
What does fix it is a second phase that measures the same quantity a different way. Mine existed by accident: the tuning phase, running closed loop to pick a pool size, disagreed with the open-loop ladder by a factor of three, and that is what raised the alarm. Today I keep it on purpose.
Three concrete things to add to your own harness:
- A second phase measuring the same quantity in a different loop (one open, one closed), and a rule that invalidates the run when the two disagree.
- A probe before every repetition: a target that runs no application code and proves that what you are measuring is really the candidate.
- A record of the environment beside each repetition. If you find out later that the number was wrong, you will also know why.
The measurement itself, the numbers that came out of it and the raw data of all three discarded attempts are in the research notebook; the full diagnosis is in the repository’s EXCLUDED.md. I keep the numbers I deleted, too — how a measurement went wrong teaches more than a correct one ever does.
The research behind this post
One core carries 14,330 OAuth2 requests in Go and 5,152 in PHP-FPM
The same API verifies an RS256 bearer token on every request and then reads or writes one row in PostgreSQL — on one, two and four cores, how much mixed traffic does it carry in Go, PHP-FPM and FrankenPHP worker mode?
Finding
On four cores Go carried 57,321 mixed requests a second, FrankenPHP 25,659 and php-fpm 20,606 — 14,330, 6,415 and 5,152 per core. The number that goes into a capacity plan is not that one but application CPU per request: 66.8, 110.7 and 187.7 microseconds. At saturation FrankenPHP uses only 2.84 of its four cores, against Go's 3.83 and php-fpm's 3.87. The database is not the constraint: on the same four cores PostgreSQL alone writes 68,212 rows a second, above the mixed ceiling of the fastest candidate.
measured yesterday
Experiments on this topic
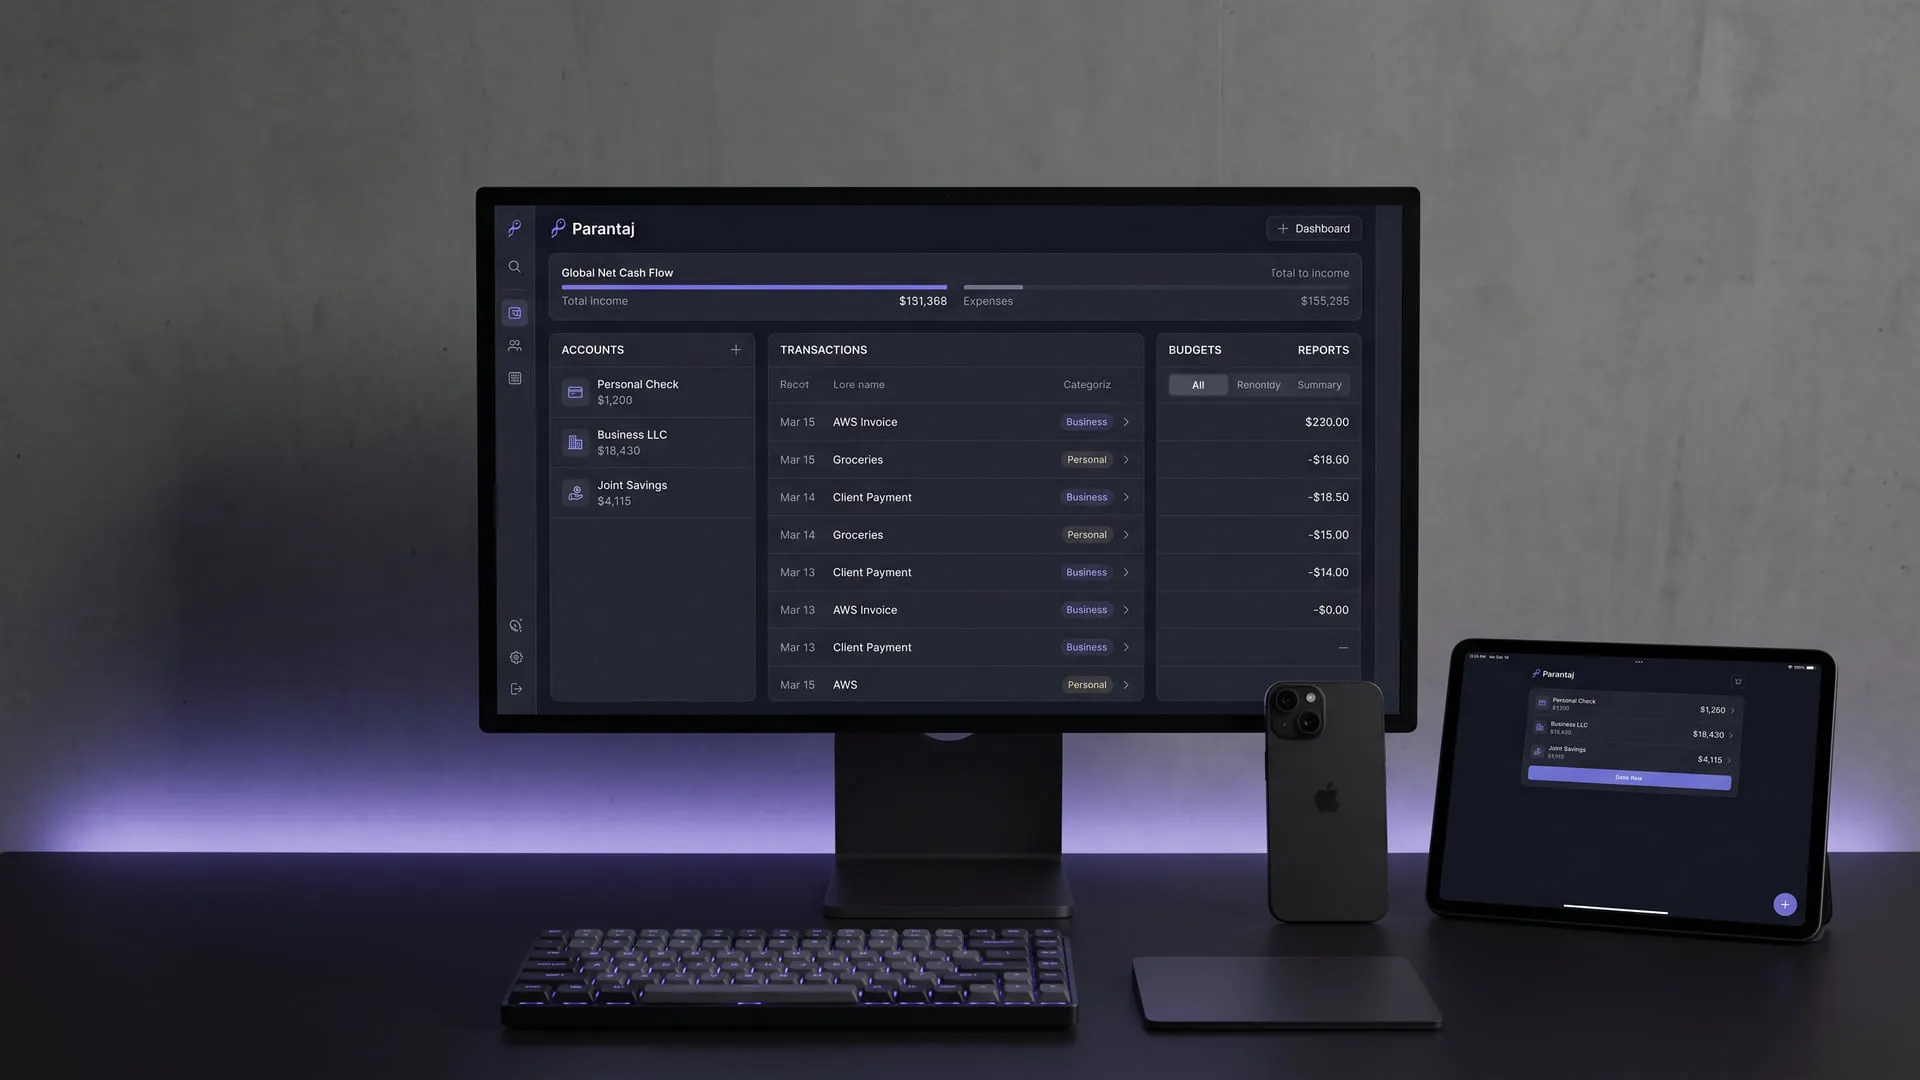
Personal and business finance on one data model
A finance core that keeps multi-account income and expense tracking in a single model; it became Parantaj, running on web, iOS and Android.
What it does today
One account/transaction model carries multi-account management, budgeting, goals and reporting on a single core; the web, iOS and Android clients are all live. Anyone who wants personal and business finances tracked in one place can use it.

Reaching production data without handing out the password
A self-hosted portal that puts ad-hoc production SQL behind approval, masking and an immutable trail; it became the QueryProxy product.
What it does today
Runs a developer's SQL against production through an approval step rather than directly; results are masked as they are written to disk and every request lands in an immutable record. Teams where production access sits with one person can run it today.
Comments
Sign in with your GitHub account to join the discussion. Comments are stored in GitHub Discussions.